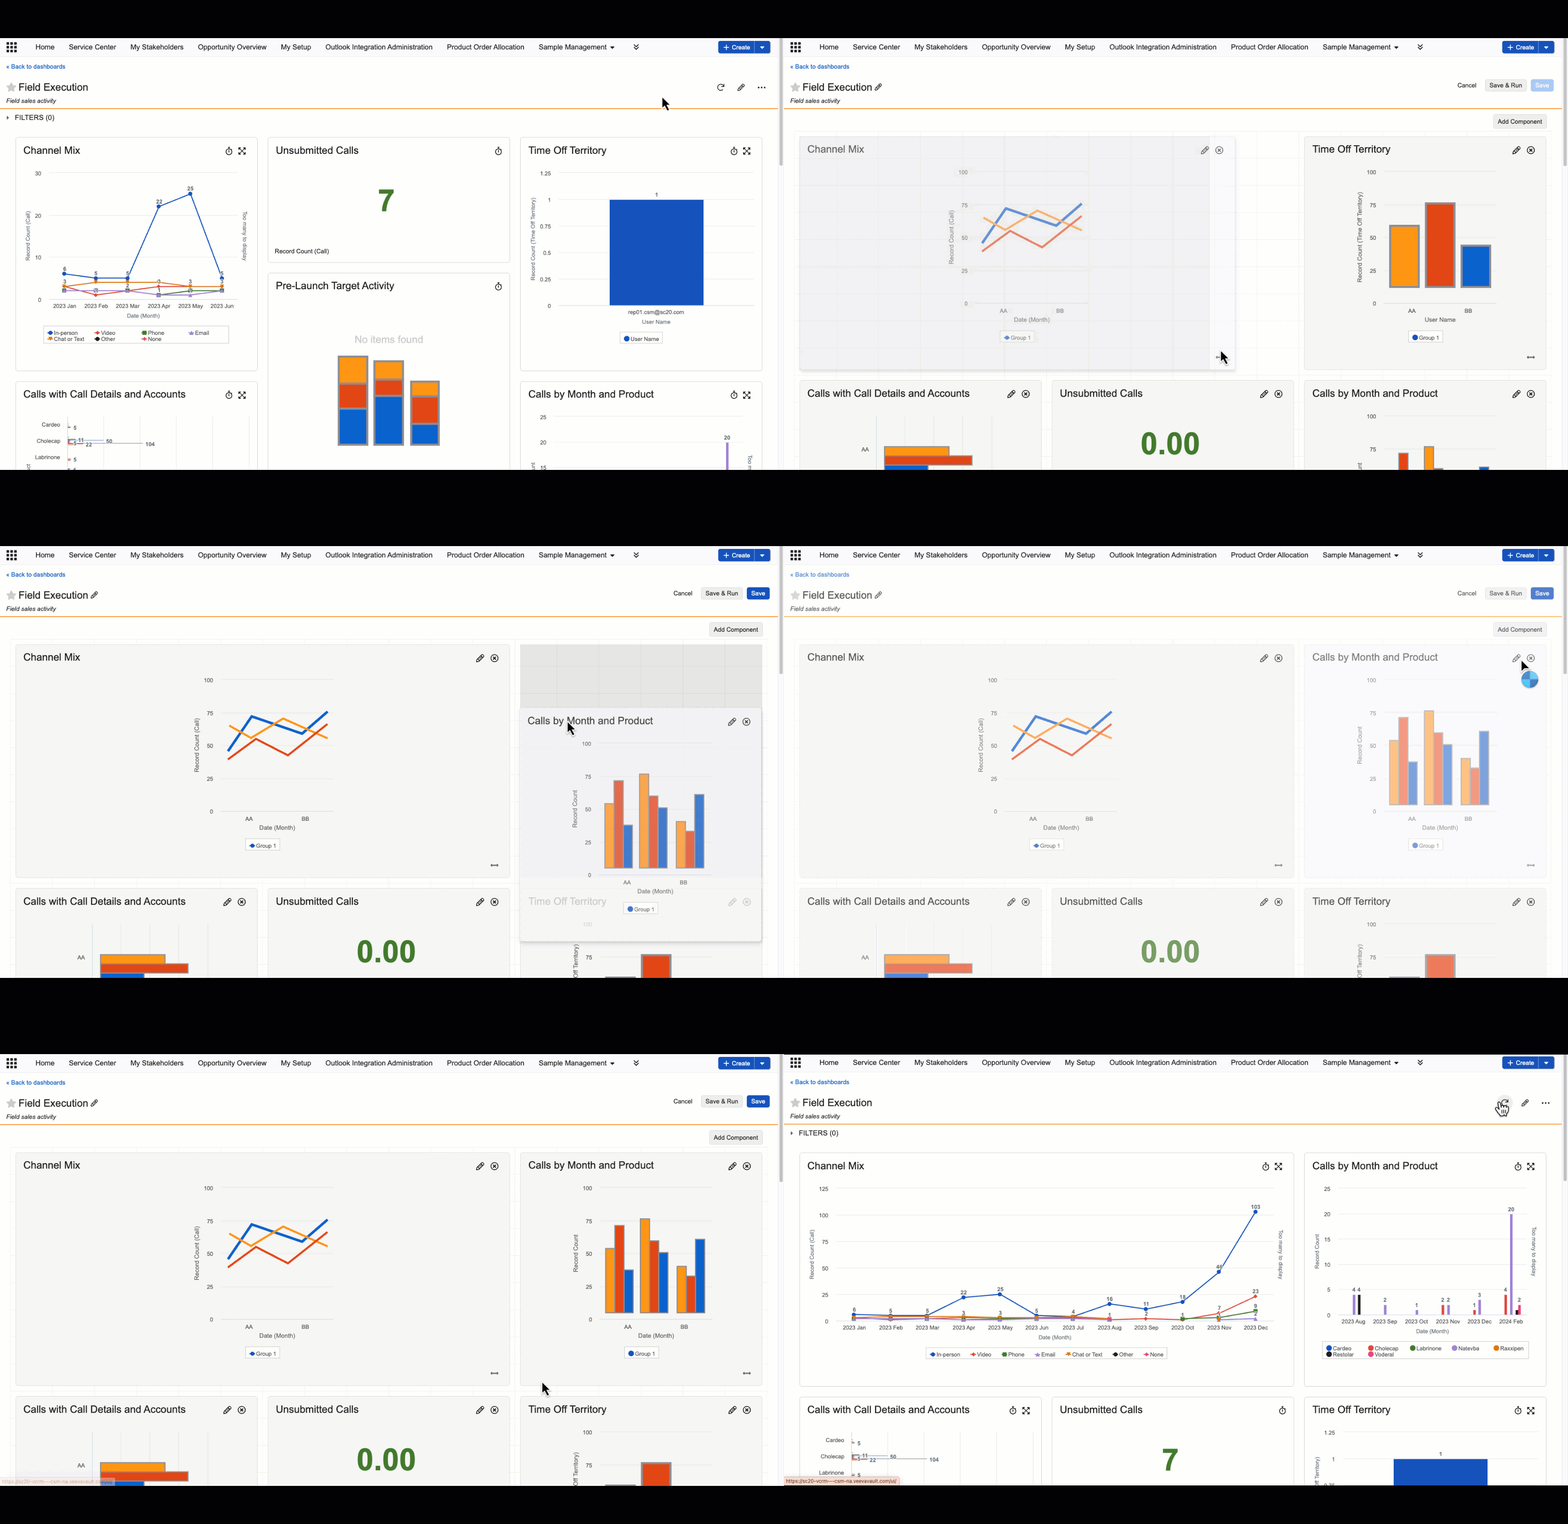
How do I customize a Dashboard?
Vault Dashboards offer extensive customization options to tailor data visualization to your team’s needs.
Key features include:
-
Drag-and-Drop Widgets - Easily arrange and configure dashboard components for a personalized experience
-
Role-Specific Configurations - Display relevant data based on user roles, ensuring that each team member sees the most pertinent insights
-
Interactive Data Visualizations - Use charts, graphs, and key performance indicators (KPIs) to make data interpretation effortless
-
Multi-Report Integration - Combine multiple reports into a single, unified view for a comprehensive analysis of your business data

For example, a sales manager can create a dashboard with multiple reports and visualizations that:
-
Monitor individual and team sales performance
-
Identify top-performing products or services
-
Track progress towards quarterly and annual targets
Organizations can also use dashboards to monitor compliance-related information:
-
Adherence to industry regulations via the submission of required documentation
-
Real-time compliance reports for internal and external audits
-
Identifying potential compliance risks early by analyzing trends in compliance discrepancies
With these capabilities, Dashboards enable teams to monitor performance in real-time, collaborate effectively, and take swift, data-driven actions. Learn more about customizing dashboards.
Select Next to learn about best practices when designing reports and dashboards.