How can I measure KPIs for content engagement?
CLM reporting provides powerful, built-in metrics to measure content performance against your key performance indicators (KPIs).
By focusing on engagement data, you can answer critical questions about your campaign’s effectiveness, for example:
-
Reach - Is the new campaign content reaching the intended audience?
-
Engagement - Are HCPs spending meaningful time with our key messages?
-
Sentiment - How are HCPs reacting to the information we’re presenting?
Imagine a brand manager for Natevba who has launched a new Natevba presentation. The marketing team’s goals for the first quarter are:
-
Reach at least 500 unique cardiologists with the new content
-
Achieve an average engagement time of 90 seconds on the main Clinical Efficacy slide
-
Secure a positive sentiment from at least 70% of HCPs
Rather than waiting for the quarterly sales data, we can create a dashboard with three reports filtered to the new Natevba content to track KPI progress in real-time.

|
Check out our Flightpath on Reports and Dashboards to learn more. |
First, create the three source reports needed for the dashboard. Each report should use the Call Key Message report type and filter for the new Natevba presentation.
-
Accounts Reached report - Include the Account column to provide the count data
-
Time Spent report - Include the Duration column
-
Reactions report - Include the Reaction column
Once the reports are created, create a new dashboard and add the following components:
-
Select the Accounts Reached report and select the Number chart type.
-
Select the Time Spent on Key Messages report and select the Gauge chart type.
-
Select the Reactions report and select the Pie chart type.
-
Select Save and Run.
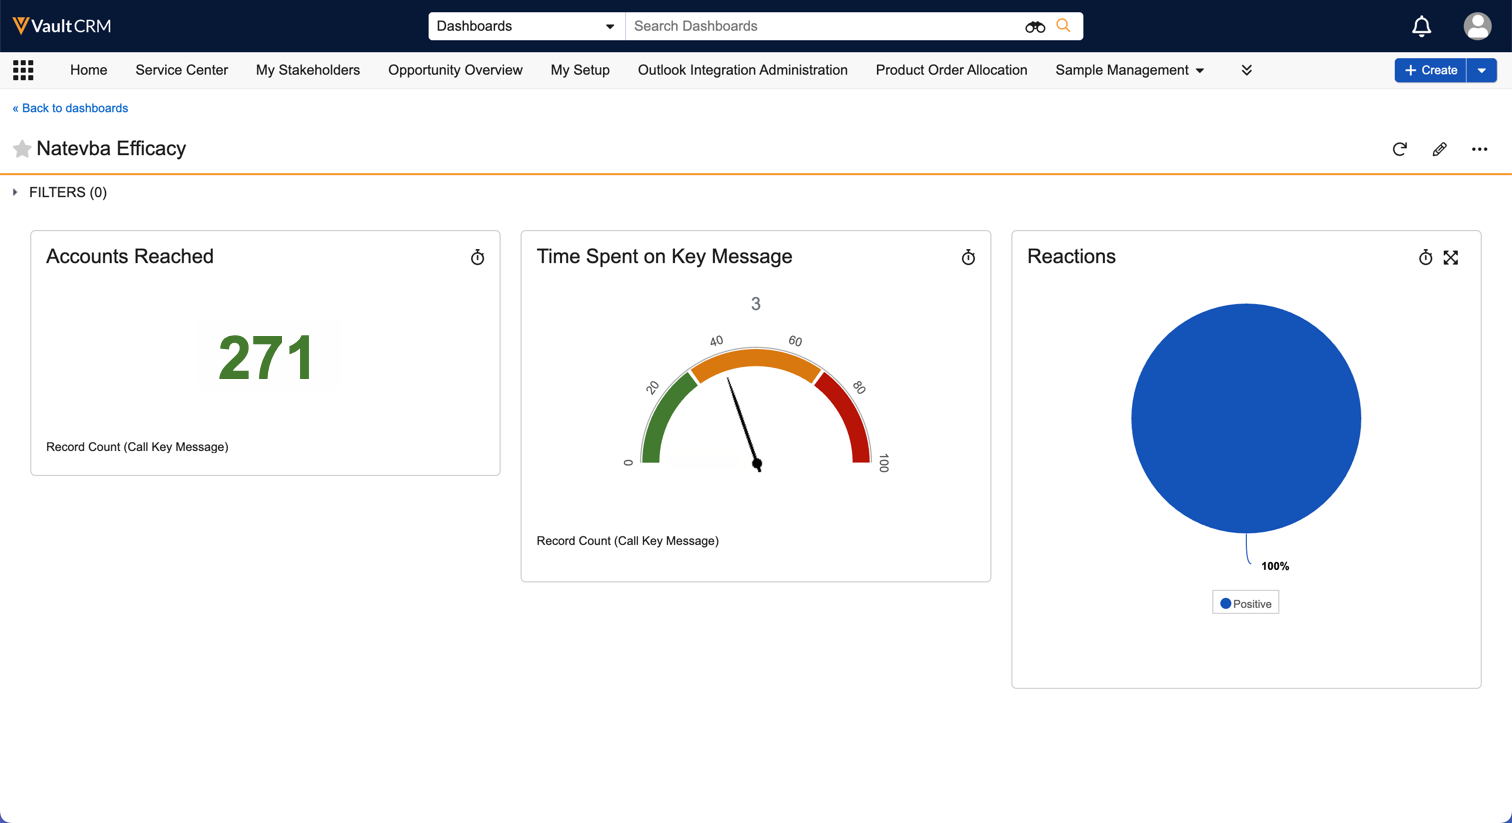
With this dashboard, the brand manager can immediately see in real-time which KPIs, mentioned above, are on track to meet their goals, and where additional efforts may be needed.