How can I configure product-specific metrics?
Empower your sales reps to be your eyes and ears in the field. Instead of just reporting which products were discussed, Product Metrics allow reps to provide nuanced feedback on an HCP's knowledge and comfort level with a specific product.

|
Learn how to configure Product Metrics for business admins and sales reps. |
What do Product Metrics capture?
Product Metrics are self-reported by sales reps to capture qualitative insights about an HCP's engagement and adoption of a specific product. This data helps measure the impact of marketing efforts.
Sales reps can use metrics to record an HCP’s:
-
Knowledge Level - The HCP’s understanding of the product’s feature, benefits, and indications
-
Comfort Level - How comfortable the HCP is with prescribing or recommending the product?
-
Inquiry Level - Is the HCP actively asking questions, indicating interest, or needing for more information?
-
Prescribing Behavior - What frequency does the HCP prescribe the product?
-
Advocacy - Can the HCP be considered an expert or potential advocate to speak to peers?
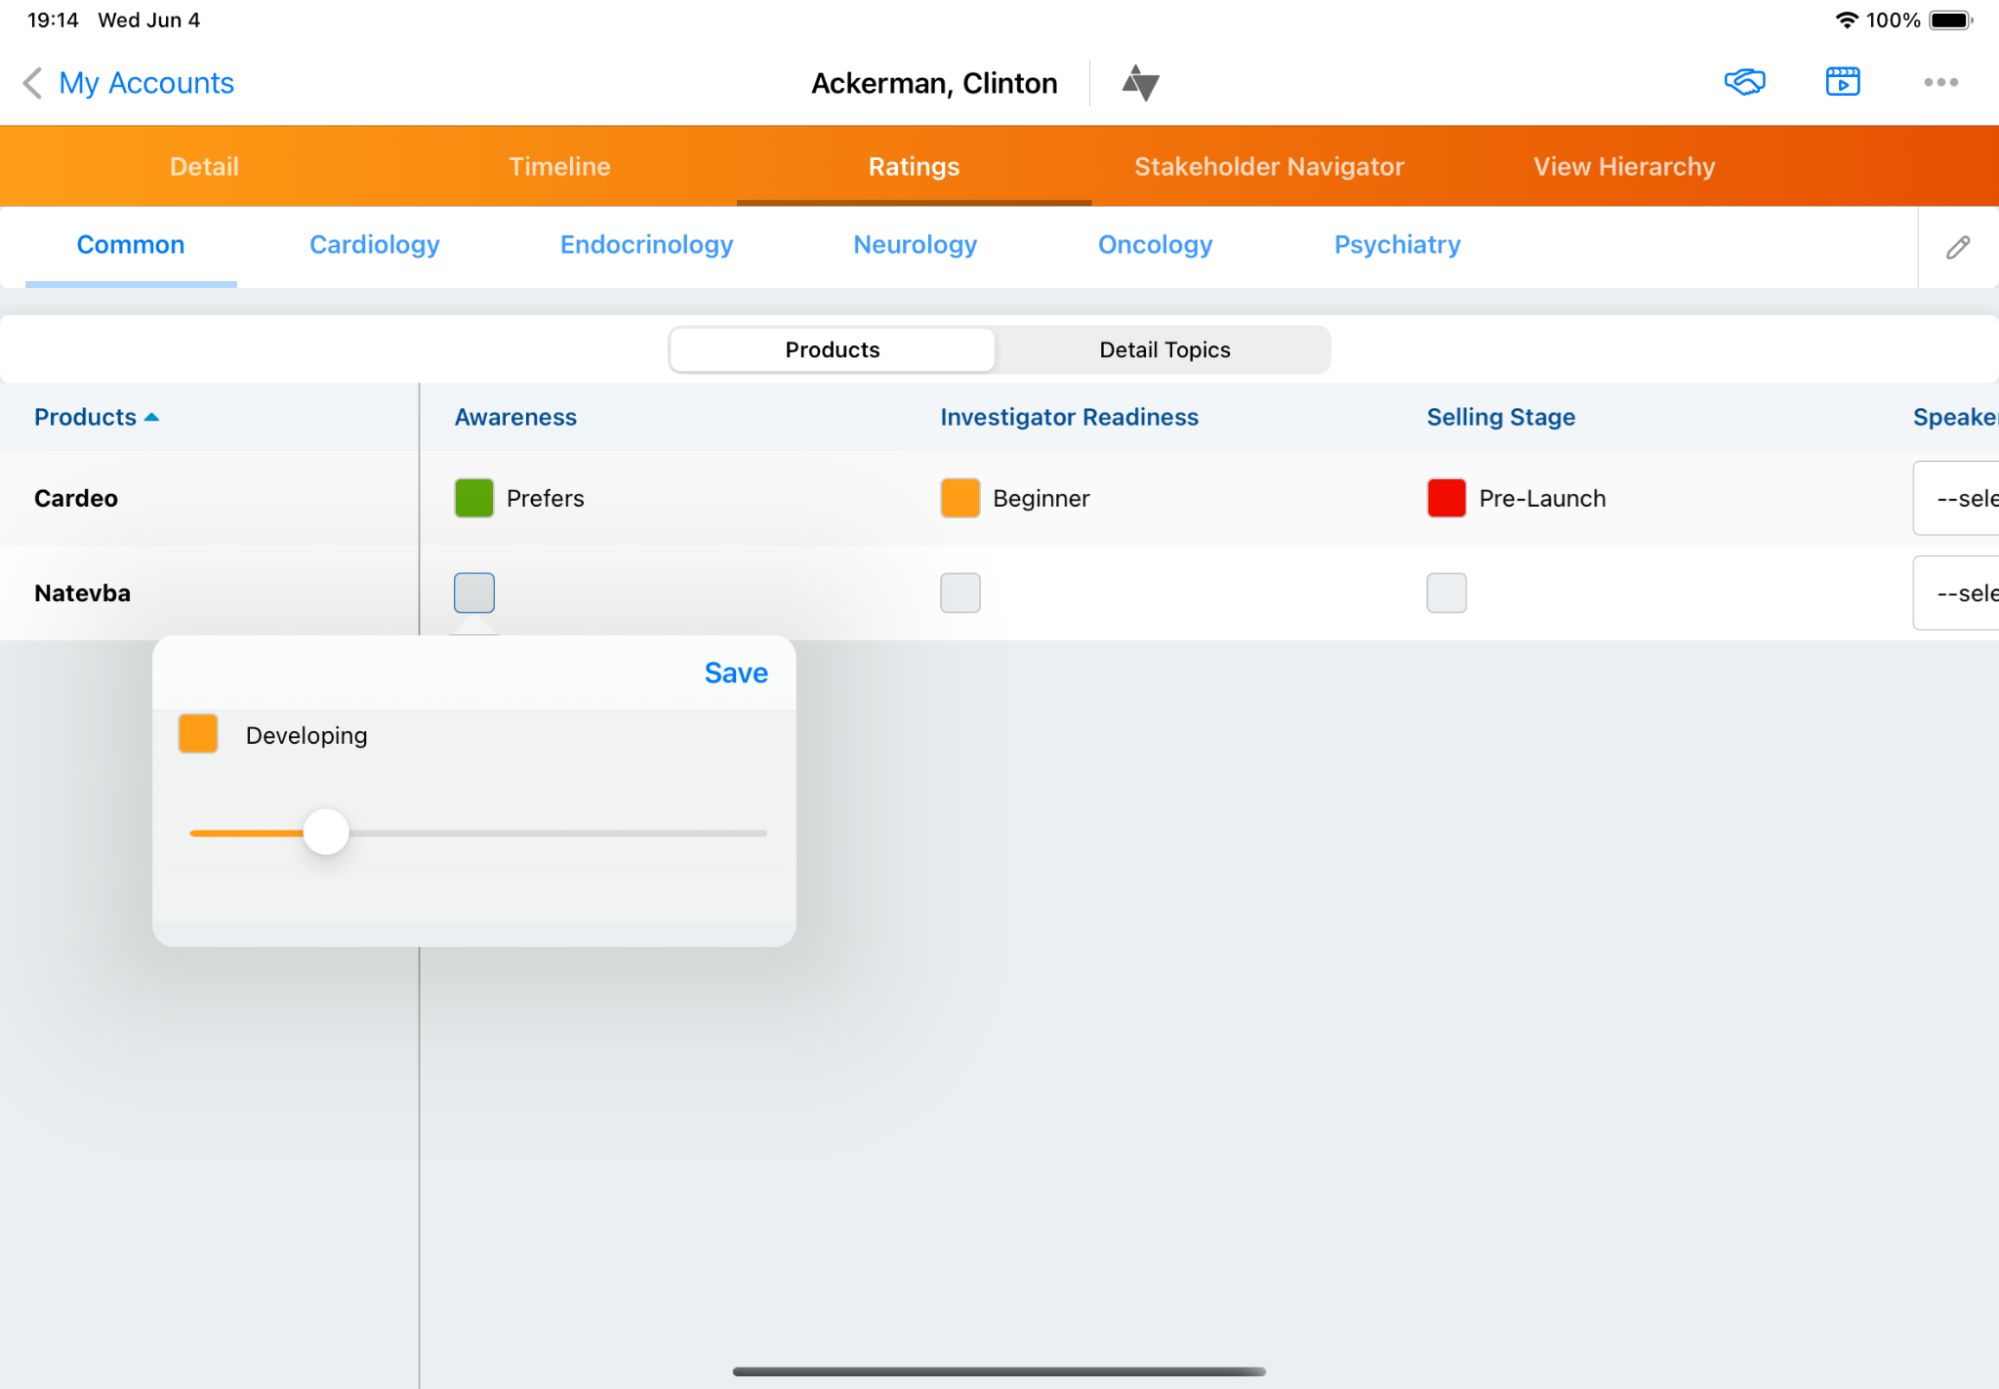
How do Product Metrics display for sales reps?
To display Product Metrics for a sales rep:
-
Select the My Accounts page.
-
Select the appropriate account.
-
Select the Ratings tab.
-
Select the appropriate Detail Group tab.
-
Select the appropriate Products or Detail Topics toggle.
-
Select the metric corresponding to the product to populate the metric’s value.
-
Select Save.
What metrics are available in Product Metrics?
Five types of metrics are available, and each can be edited inline by selecting the metric in the table:
-
Box Picklist – Displays a colored indicator next to the picklist value. End users edit the value using a slider.
-
Box Picklists support a maximum of 10 values specified in the Product Metrics object. If you list more than 10 values, the metric does not display.
-
-
Text Picklist – Displays a plain text value
-
Number – Displays a number, currency, or percent. The user is presented with a keypad to enter the value.
-
Arrows – Displays up, horizontal, and down arrow indicators in red, yellow, or green to illustrate a trend. The user is presented with a keypad to enter data.
-
Check box – Displays a check box
|
|
Five types of metrics are available, and each can be edited inline by selecting the metric in the table:
|